Reviews in Rhyme: Podcast Fiction Edition
Continuing the theme from yesterday’s book reviews, here are limericks about some short stories I listened to today. (Spoiler warning!)
Another End Of The Empire by Tim Pratt (via PodCastle 88)
The dark lord ruled the land with no ruth,
but his doom was to lose it to youth.
To escape prophesy,
he ruled graciously,
and in peace came the oracle’s truth.
Sometimes audio narrations make me cringe (especially when men attempt to deliver female dialogue in falsetto), but Cheyenne Wright’s reading of this story was great fun.
The Last Great Clown Hunt by Chris Furst (via Drabblecast 148)
On the Plains roam the tribes of the clowns,
the Bozos who were banished from towns.
A clown hunter-cum-cop
who’s tasked to the big top
meets his brother, the chief, which confounds.
I don’t like clowns, but I love the “native” clown names in this story, such as Runs With Scissors. Hilarious sound effects complement the somber telling of this tale.
The Cat Who Walked A Thousand Miles by Kij Johnson (via Tor.com Story Podcast 6)
In Japan lived a cat who was small
with her aunts by a gardened old hall,
but the earth shook and turned
and the garden was burned
so the cat ran away from it all.
The encounter with the monk at the end of this story nearly brought a tear to my eye. (Actually, it seems the narration was abridged, so the story continues after that scene. Fortunately, the beautifully-illustrated full text is available in a variety of formats.)
Posted on Monday, February 1st, 2010. Tags: drabblecast, limerick, podcastle, reviews, torstory.
Recent Books in Rhyme: Fiction Edition
Here is a list of novels I’ve recently read, inspired by a similar list my dad posted earlier this month.
I didn’t feel up to the task of writing accurate synopses or insightful reviews, so instead I wrote limericks.
Sundiver by David Brin
E.T. smarts don’t evolve on their own;
they’re doled out to new Clients on loan.
But we humans are jerks
and we gum up the works
’cause we show you can go it alone.
Blindsight by Peter Watts
On the edge of deep space there awaits
thoughtless threat to the Earth and our fates –
so we sent some misfits,
in a ship well equipped,
for our heroes are all reprobates.
Ilium by Dan Simmons
The post-humans are gods up on Mars
who go Greek ‘stead of aiming for stars.
They enact Homer’s texts
– Helen has lots of sex –
and regret acts of key charactars.
The Road by Cormac McCarthy
So this man and his son hit the road,
With a cart and some cans in the cold.
They struck out for the coast,
saw a cannibal roast,
and at last the man died as forebode.
Lamentation by Ken Scholes
A mechanical man cast a spell
and the city from which he hailed fell.
This pawn burdened with blame
for all lost to the flame
will rebuild it as others raise hell.
Hope you enjoyed that!
Posted on Sunday, January 31st, 2010. Tags: limerick, reviews.
Online LDraw Viewer

Click here to view some digital bricks right in your browser.
It’s a quick late-nite first-draft online adaptation of the Processing LDraw viewer I’ve been playing with.
Posted on Tuesday, January 12th, 2010. Tags: code, LEGO, processing.
Setting up Andy’s LDraw Viewer
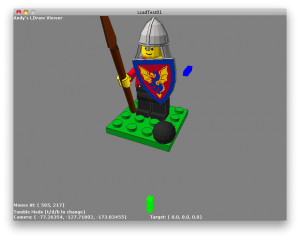
Andy has posted the Processing code for the nifty little LDraw viewer I mentioned in my previous post.
Processing gives you a decent among of guidance, but for your reference here’s what I did to get this up and running:
- Download and unzip
ProcessingLcad-Oct2008.zip. - Rename the
LcadTest-Oct2008folder toLcadTest01in order to match the project file it contains. - Move the contents of the
LcadTest01/libs/folder to your Processing sketchbooklibrariesfolder. In my case, it is/Users/anoved/Documents/Processing/libraries/. - Move the contents of the
LcadTest01/models/folder to themodelssubfolder of your LDraw library. Alternatively, you can editLcadTest01.pdeto load a model of your choice. - Open
LcadTest01.pdeand editBaseDirto identify your LDraw library folder. In my case, it is/Users/anoved/Documents/LDraw/.
Lastly, if the capitalization of the LDConfig.ldr file in your LDraw library does not match that specified later in LcadTest10.pde, edit one or the other so they are in agreement.
Now you can take it for a spin. And, yes, this viewer can load files with Unix line endings. ☺
Posted on Monday, January 11th, 2010. Tags: code, LEGO, processing.
Beginning Processing
Processing is a system that makes it as straightforward as possible to do some pretty sophisticated graphics programming. Based on Java, it abstracts enough technical details to let you focus, more or less, on the basic logic of the idea you want to animate. From the web site:
It is used by students, artists, designers, researchers, and hobbyists for learning, prototyping, and production. It is created to teach fundamentals of computer programming within a visual context and to serve as a software sketchbook and professional production tool.
Check out the Exhibition for some examples of what’s possible and the Tutorials to see how easy it is get started. There is a great collection of examples for specific topics, too, most of which include illustrative applets embedded in the page. The ability to export Processing programs (or “sketches”) as applets is particularly appealing, although my understanding is that some features, such as file I/O, are available only in application or development mode. It works cross-platform.
I know I have encountered Processing before, but my current interest began as I read Andy Lynch’s description of a simple LDraw renderer he implemented as a Processing sketch. That lit a fire under some related ideas of my own that have been simmering for want of an optimal outlet.
But there’s more to my interest than digital bricks: if there isn’t already a decent library (which would be surprising, as many useful libraries seem to be available), I might be tempted to write a shapefile loader, if for no other reason than to complement the shapefile parser I once wrote for Chipmunk Basic. I think it could be fun to experiment with some raster GIS and remote sensing ideas in Processing, too. (Just get the spectral signatures – click, click, click – and you do it. That’s all what it is!) Last but not least, per its original intent, I can envision using Processing as a superior tool to visualize certain data.
What sort of Process will you invent?
Posted on Monday, January 11th, 2010. Tags: code, geography, LEGO, processing.
Kitgen Build System for Tcl/Tk
In the past I have written a variety of posts about Starkits and Starpacks. Briefly, Starkits provide a way to package complex Tcl/Tk programs in a single file, and Starpacks allow those packages to be combined with self-contained interpreters to deliver stand-alone applications. However, the Tclkit interpreters I originally used for this purpose have not generally been maintained, at least for Mac OS X (Pat Thoyts has done a good job providing current Windows and Linux versions).
Of course, there are various ways to build your own Tclkit equivalent, but I usually found the process slightly too tedious to sustain my interest (although I did succeed with Pat’s version of kitgen shortly before discovering the method described below).
As it turns out, self-contained Tcl/Tk installations functionally equivalent to Tclkits can quite easily be created with the kitgen build system. This comprises a single Tcl script (kbs.tcl) that automates the process of downloading, compiling, and assembling the elements of a “kbskit”. The script is robust – it worked successfully on the first try, without any knowledge of what options to use beyond those given in the Quick Start examples.
If you simply run a fresh copy of kbs.tcl, it will retrieve the Tcl/Tk sources.
Build a Metakit-based kbskit (like Tclkit) with:
./kbs.tcl -r -mk install kbskit8.5
Build a Vlerq-based kbskit (like Tclkit Lite) with:
./kbs.tcl -r -vq install kbskit8.5
In either case, three executables will actually be built:
- A Tcl-only executable, denoted by
-clisuffix - An executable that loads Tk from an external library if needed, denoted by
-dynsuffix - An all-in-one Tcl/Tk executable, denoted by
-gui
On Mac OS X, these executables are found in the buildDarwin subdirectory relative to kbs.tcl. The subdirectory name will presumably differ on other operating systems.
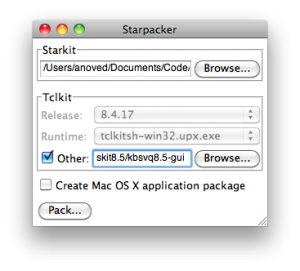
Happily, the kbskits created with the kitgen build system can be used with Starpacker. Check the “Other” box and select the kbskit you prefer to use as the executable in your Starpack:
You can bundle other packages into your kbskits using the -mk-bi or -vq-bi options (-bi stands for “Batteries Included”). This will ensure that those packages (typically useful extensions) are always available to code being run by that kit. Of course, a different approach, with different advantages and disadvantages, is to bundle packages in your application Starkit, which can be executed with different kits.
Additional topics to explore include building the --enable-aqua option and the best method to update both kbs.tcl and the source code it retrieves.
Posted on Sunday, January 10th, 2010. Tags: code, mac, tcl.
LDraw Files, Line Endings, and an Ecosystem Inventory
The general LDraw File Format specification is silent on the matter of line endings, but the File Format Restrictions for Official Parts requires DOS/Windows (“CRLF”) line endings. A recent discussion caused me to become curious whether there are really any contemporary compatibility reasons for this recommendation. So, I decided to take an inventory of LDraw programs to see which, if any, had trouble opening files formatted with Unix (“LF”) line endings.
![]()
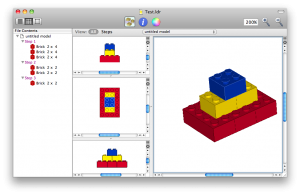
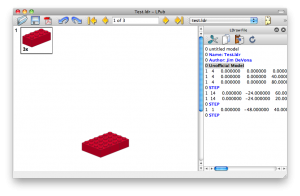
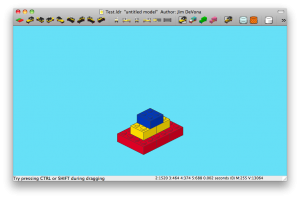
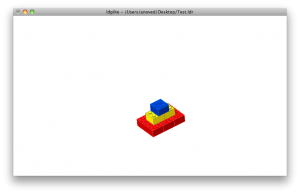
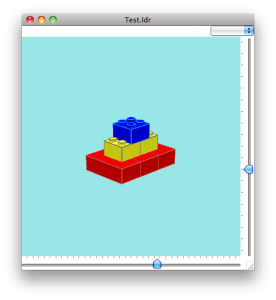
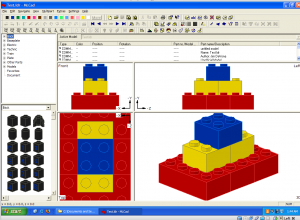
Here is a simple sample model, Test.ldr. It was created with Bricksmith, which outputs files with DOS line endings per the official file format restrictions. I used a text editor to convert the line endings to Unix format.
![]()
What programs can read the test model?
Bricksmith 2.3.1 can do it.
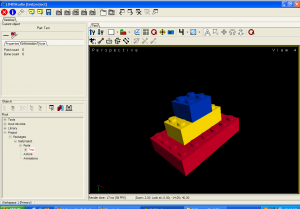
LDView 4.1 can do it (with no warnings or errors).
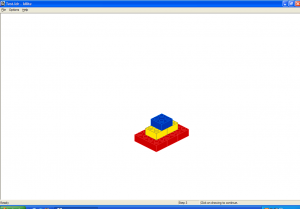
LPub 4.0.0.4 can do it.
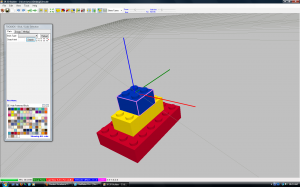
L3Lab 1.3 Beta can do it.
ldglite 1.0.18 can do it.
Mac Brick CAD 3.0b1 can do it.
BrickDraw3D 0.5b can do it.
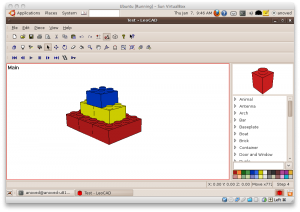
LeoCAD 1.75 for Linux can do it.
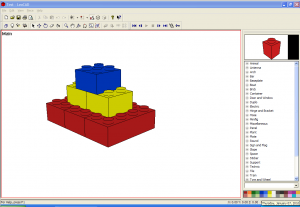
LeoCAD 1.75 for Windows can do it.
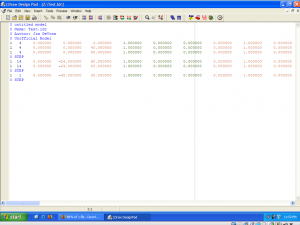
LDraw Design Pad 1.5.7 can do it.
MLCad 3.2 can do it.
LD4DStudio 1.1 can do it.
LDLite 2.4 can do it.
SR 3D Builder 0.4.5.7 can do it.
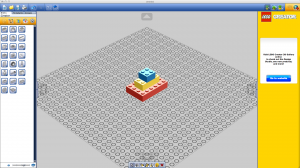
LEGO Digital Designer is not strictly part of the LDraw system of tools, but LDD can import it, too.
Command-line tools like L3P 1.3, LDTrim 1.1, and LSynth 3.1 can do it (there’s nothing for LSynth to synthesize in this case, of course).
l3p Test.ldr → Test.pov → povray Test.pov → Test.png
ldtrim -in Test.ldr -out Test-trim.ldr
lsynthcp Test.ldr Test-synth.ldr
As a sample of Philo’s LDraw tools for part authors, I modified some of the example files included with Coverer to use Unix line endings.
coverer arc1.dat arc2.dat myarcoutput.dat
The program ran without any trouble.
![]()
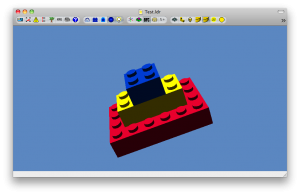
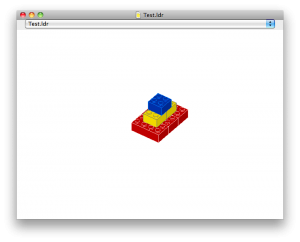
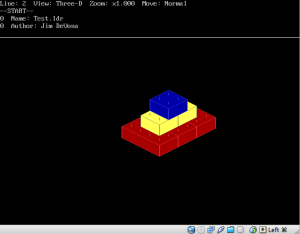
James Jessiman’s original LDRAW and LEDIT programs (downloadable here) can’t do it – but they’re worth celebrating anyway, so here’s a screenshot of LEDIT looking at the DOS-formatted version of the test model:
I could not find a downloadable copy of LDAO (LDraw Add-On) to test. According to the discussion that inspired this inventory, it too is at least partly dependent on DOS line endings.
![]()
With the exception of the inimitable original, none of the many LDraw programs I could test had any trouble interpreting files formatted without DOS line endings.
My conclusion is that the official part file format recommends DOS line endings solely for backwards compatibility with the program that inspired the system. This is not bad, but it’s worth recognizing. As long as there is no inconvenience to other programs or their users, I see no reason to abandon this situation. We have a format that preserves compatibility with older components, and tools that are robust enough to understand reasonable exceptions to the format.
Anyway, here’s a hearty pat on the back for the folks who have made so many nifty ways to play with virtual bricks.
Posted on Friday, January 8th, 2010. Tags: LEGO.
Saab
Longtime readers may be familiar with space truck, the mayhem machine I have piloted with affection and mortal respect since 2002. Space truck was recently retired, concluding years of honorable service.
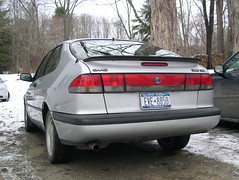
As a replacement, I have acquired a far more practical and economical vehicle: a 1996 Saab 900 SE turbo. It is, however, a worthy successor, replete with personality and motive power.
Posted on Tuesday, December 29th, 2009. Tags: car.
Making a Studded Bike Tire
Inspired by a tutorial discovered via BikeHacks, I decided to make a studded bike tire to facilitate pedal-powered winter adventure.
I started with an old spare tire, and six 98¢ bags of screws:
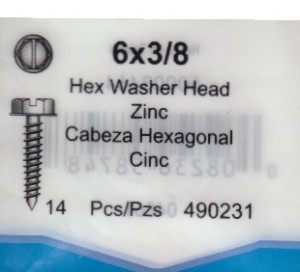
Then I sat down and drove all 84 of those puppies into the tire:
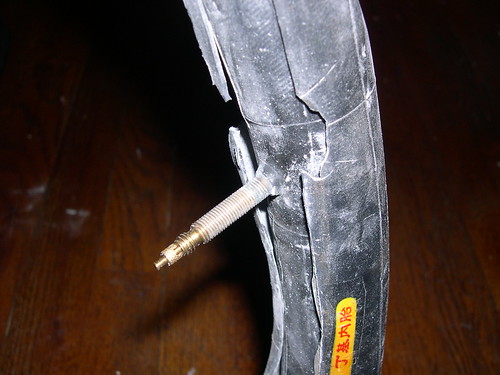
I opted to stick with the points-in approach rather than the less labor-intensive points-out approach. I used a bench grinder to blunt the points of the screws:
Even without points, the screws constitute a threat to the inner tube. Mr. Tuffy liners are recommended for the purpose of extra puncture protection, but I’m trying a cheaper approach – a second layer made of scavenged inner tube:
I installed the tubes in the tire and mounted it on a rim. As I only have one studded tire, I’m using it in the front. I conjecture that steering is more important than acceleration in preventing icy wipe-outs.
It works! On hard pavement, the studded tire rolls with a prickly sound like tearing fabric. I’ll post some some winter action shots soon.
Posted on Monday, December 21st, 2009. Tags: bike.
yjnote
yjnote is a Mac OS X command-line tool for creating note items in Yojimbo. You can use it to pipe the output or usage notes of other programs into Yojimbo for reference or logging purposes.
Download
Download yjnote.zip (1.7 KB)
Tested, minimally, with Yojimbo 2.1 on Mac OS X 10.6.2. yjnote is written in Perl with a pinch of AppleScript. Further testing, bug fixes, and improvements are welcome (and likely necessary).
Usage
You can display this documentation at any time with yjnote -help.
NAME
       yjnote − Create Yojimbo notes from the command line.

SYNOPSIS
         yjnote [options] [FILE...]

DESCRIPTION
       yjnote creates a Yojimbo note by concatenating the contents of the
       given files (or by reading standard input, if no files are given).

OPTIONS
       −title TEXT
           Sets the note item title.

       −comments TEXT
           Sets the note item comments.

       −label TEXT
           Sets the note item label. Ignored if the label does not exist.

       −tags TAG[,TAG,...]
           Sets the note item tags. Separate tags with commas.

       −flagged
           Flags the note item.

       −reveal
           Reveals the newly created note in Yojimbo. By default, the new note
           is not displayed.
Posted on Sunday, December 13th, 2009. Tags: applescript, mac, perl, yojimbo.
