Creating Heightmaps of Large Regions
An open question from Josh Ajima about making 3D printable models of Virginia prompted me to consider the general problem of finding a suitable elevation dataset for a large region like a state.
@DesignMakeTeach Here’s a start. (https://t.co/qS9F9kWMeQ clipped to state boundary & saved at quarter res. in QGIS) pic.twitter.com/hmwwX7dj6U
— Jim (@anoved) September 28, 2015
In this post I will explain how I made the image I posted in reply, using free tools and data.
Tools
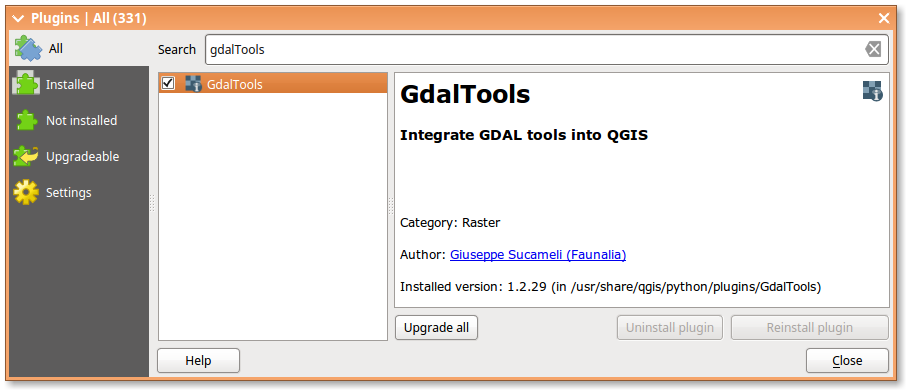
I use QGIS, a free cross-platform GIS. I also use the GdalTools plugin. It is distributed with QGIS, but you may need to install or activate it via the Plugins > Manage and Install Plugins dialog:
An image editor like GIMP capable of manipulating and converting TIFF images is also useful.
Data
For many of my terrain models, I use SRTM data retrieved from EarthExplorer. However, that data is published in 1° tiles that are tedious to mosaic and unnecessarily detailed for some purposes. So, rather than patch together many small images, I clip the desired area from one big image.
- USGS Small-scale Elevation Dataset (elev48i0100a): This layer consists of a single GeoTIFF image covering the lower 48 states at a resolution of 100 meters per pixel. (Heads up – the download linked from the info page is over 1 GB and unzips to more than 3.)
- Natural Earth – Admin 1 – States, provinces: I use state boundaries from this layer as a mask to select elevation data from the nationwide image. You can of course use any overlapping polygon features or even a simple rectangular selection as your clipping mask.
Process
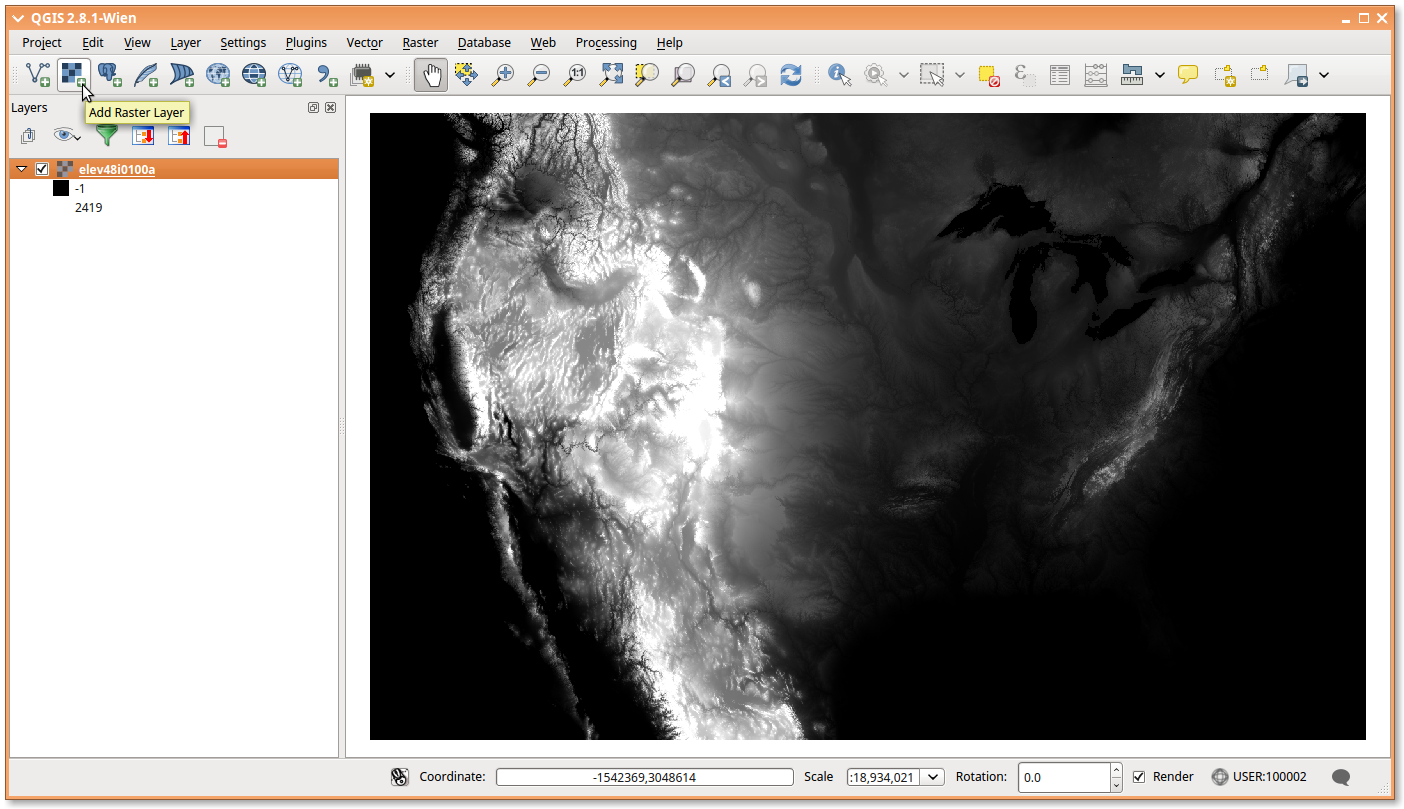
- Start a new QGIS project and click
Add Raster Layerin the toolbar. Load the big elevation dataset (elev48i0100a.tif):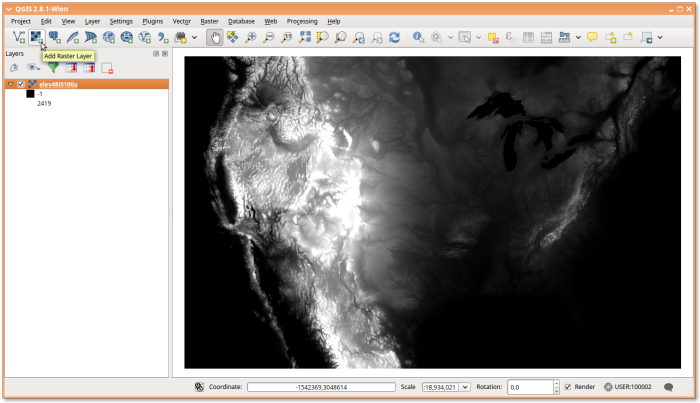
- Go to
Project>Project Properties>CRS(Coordinate Reference System) and checkEnable 'on the fly' CRS transformation. Keep the “Generated CRS” selection – it is based on the layer you just loaded.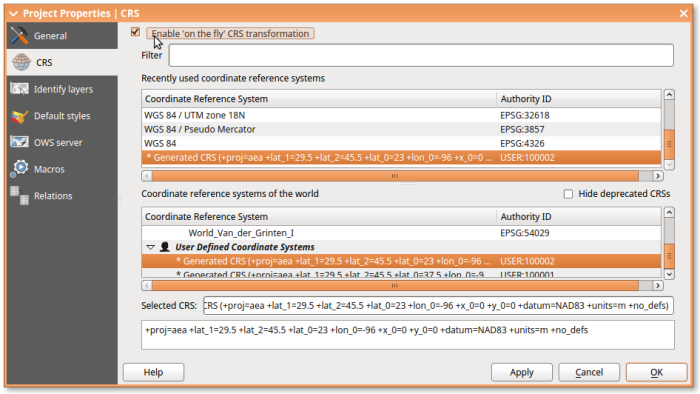
Don’t sweat the sight of all the codes and numbers. This step just ensures that different layers will appear aligned even if their files use different coordinate systems.
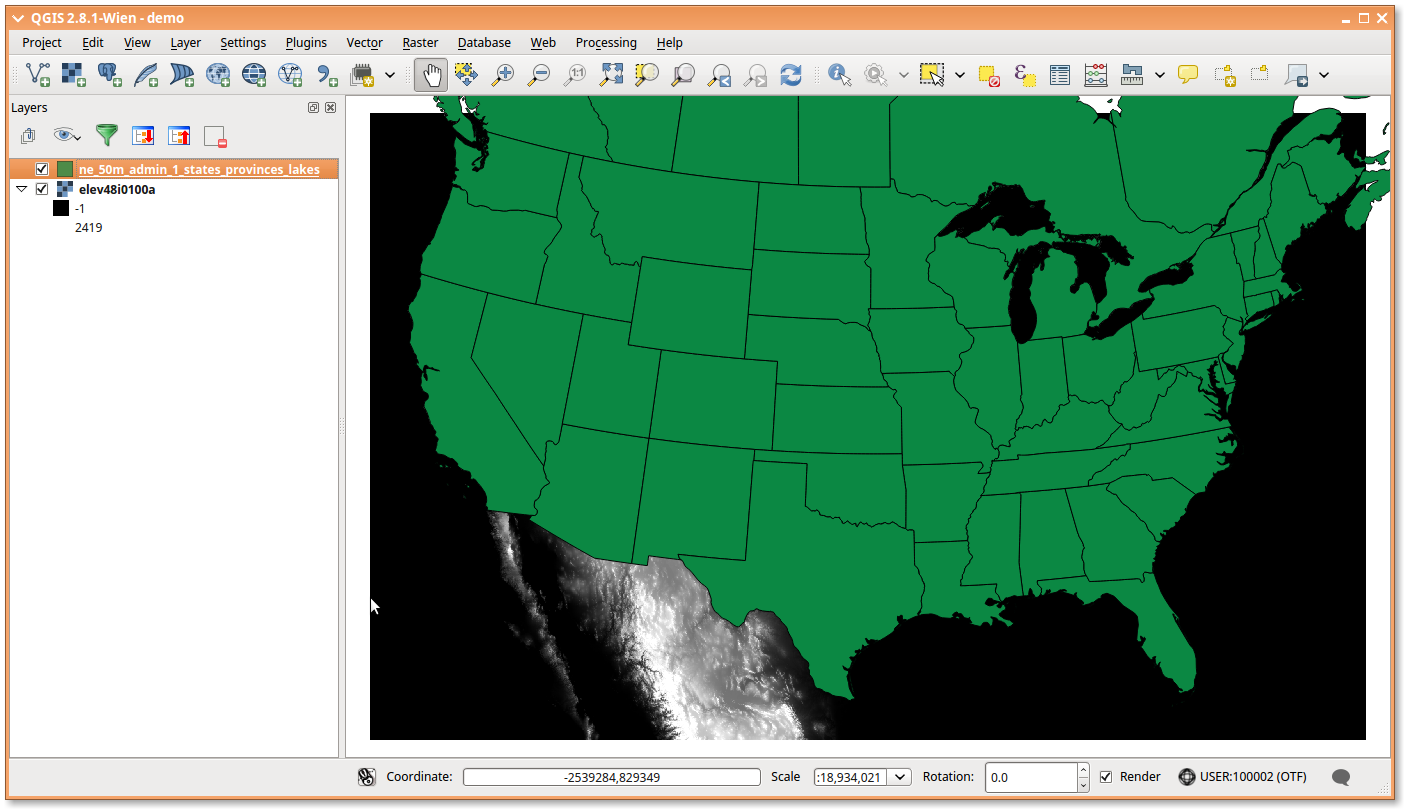
- Click
Add Vector Layerin the toolbar and load the boundary layer (ne_50m_admin_1_states_provinces_lakes.shp). It will appear on top of the elevation image.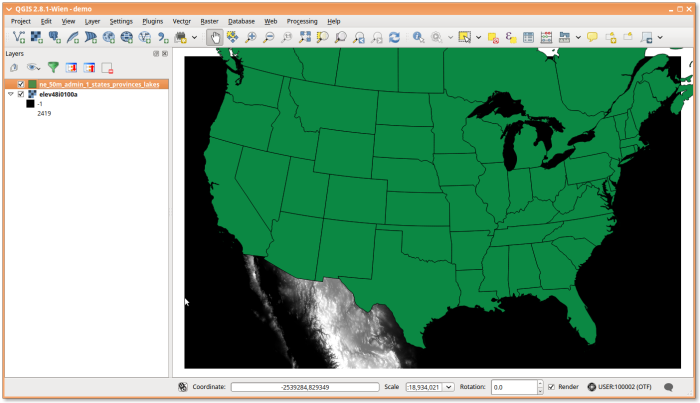
- Right click the boundaries layer and select
Filter. Type or use the provided interface to enter a query like"name" = 'Virginia'.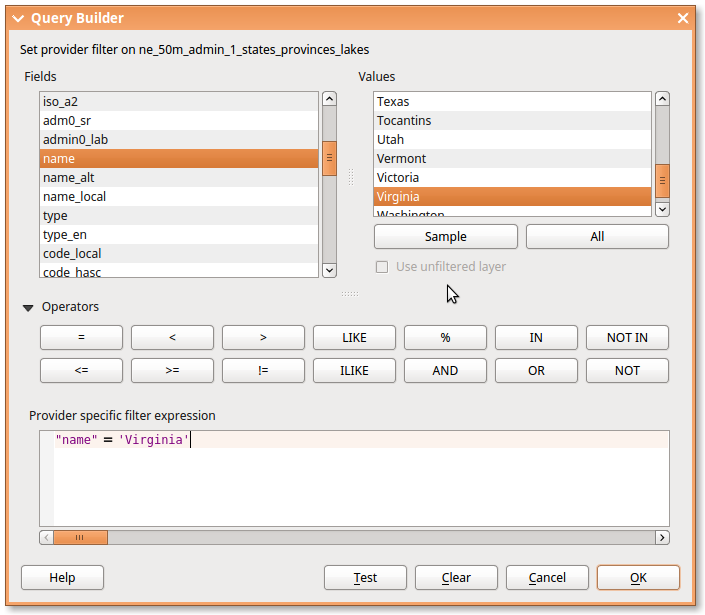
This hides everything except the desired feature, making the layer useful as a selection tool. Right click the layer again and select
Zoom to layerfor a closer look.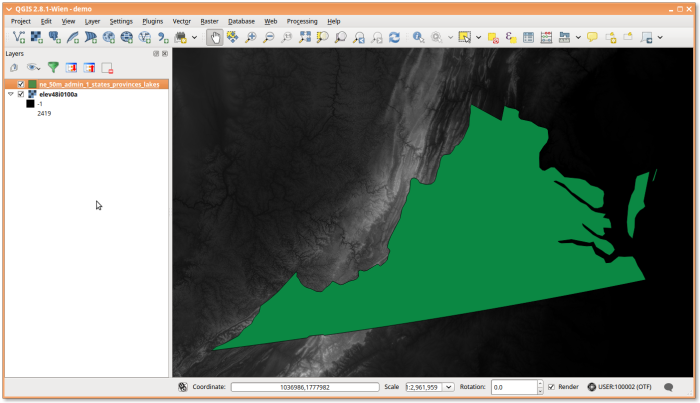
- Next, right click the boundary layer once more and select
Save As. Select the sameCRSyou previously selected in Project Properties and set an output filename likevirginia. The other default options should suffice.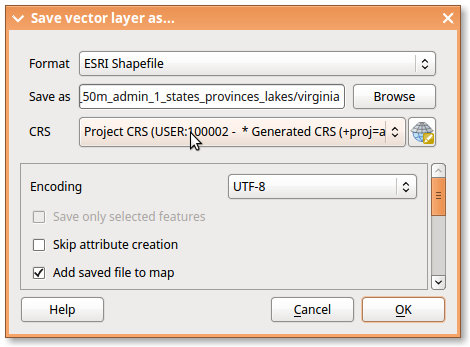
The result is a new layer consisting only of the selected state. Furthermore, it is saved using the same coordinate system as the elevation layer. This is important because the plugin tool we’re about to use doesn’t know about “on the fly” display translations.
- Everything so far has been setup. Now, open the
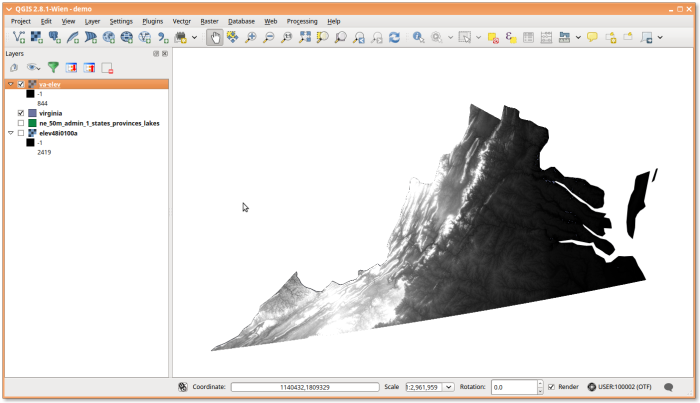
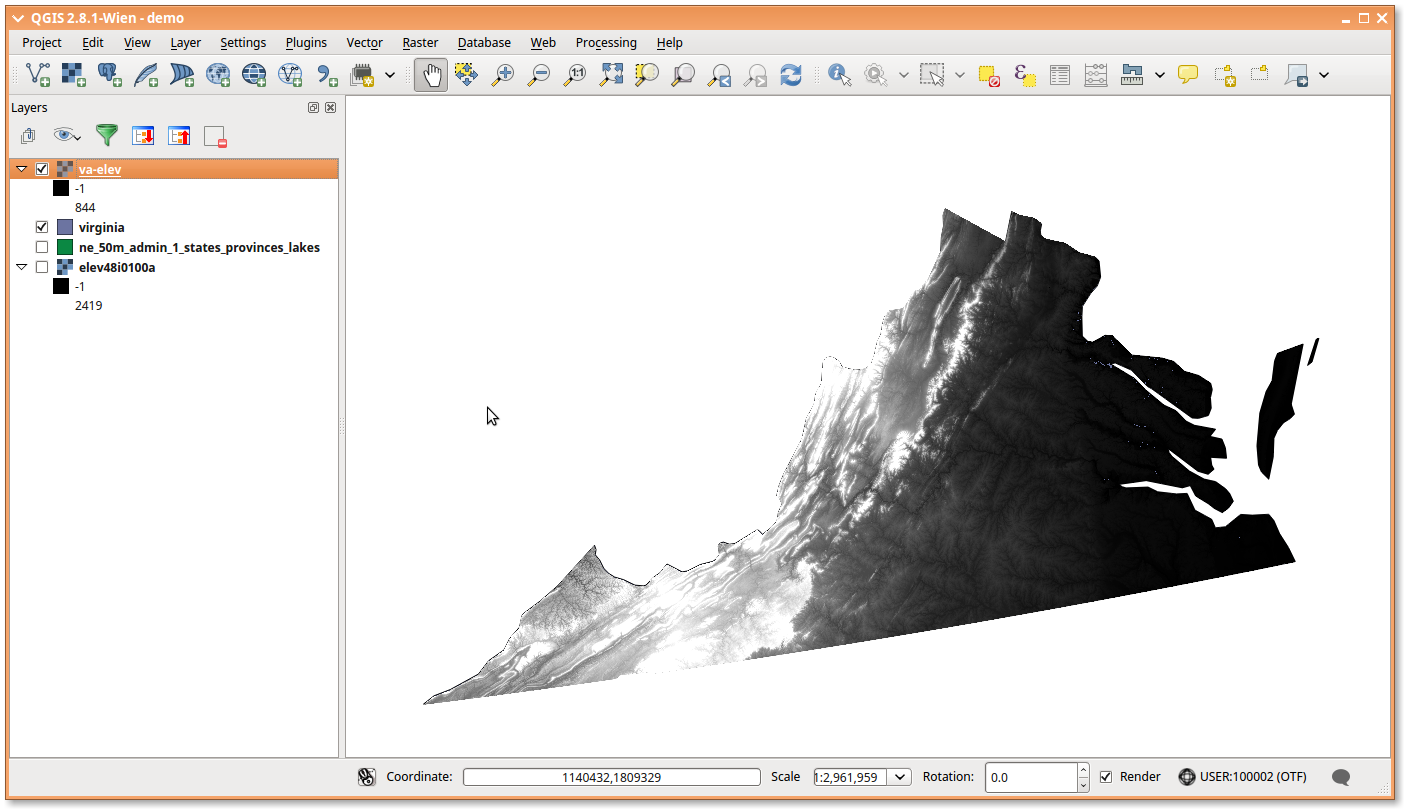
Raster>Extraction>Clipperplugin and ensureelev48i0100ais selected as theInput file. Set an output filename likeva-elev.tif, selectvirginiaas theMask Layer, and consider setting aNo data valueof-1to help distinguish transparent areas from sea-level regions.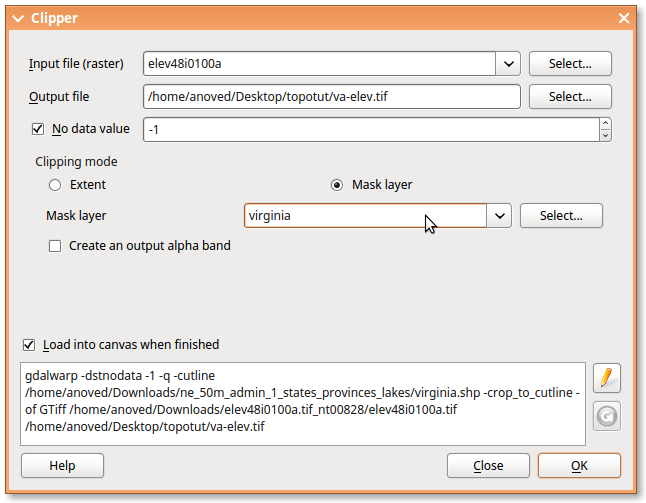
The result is a new raster elevation layer cut to the state boundary:
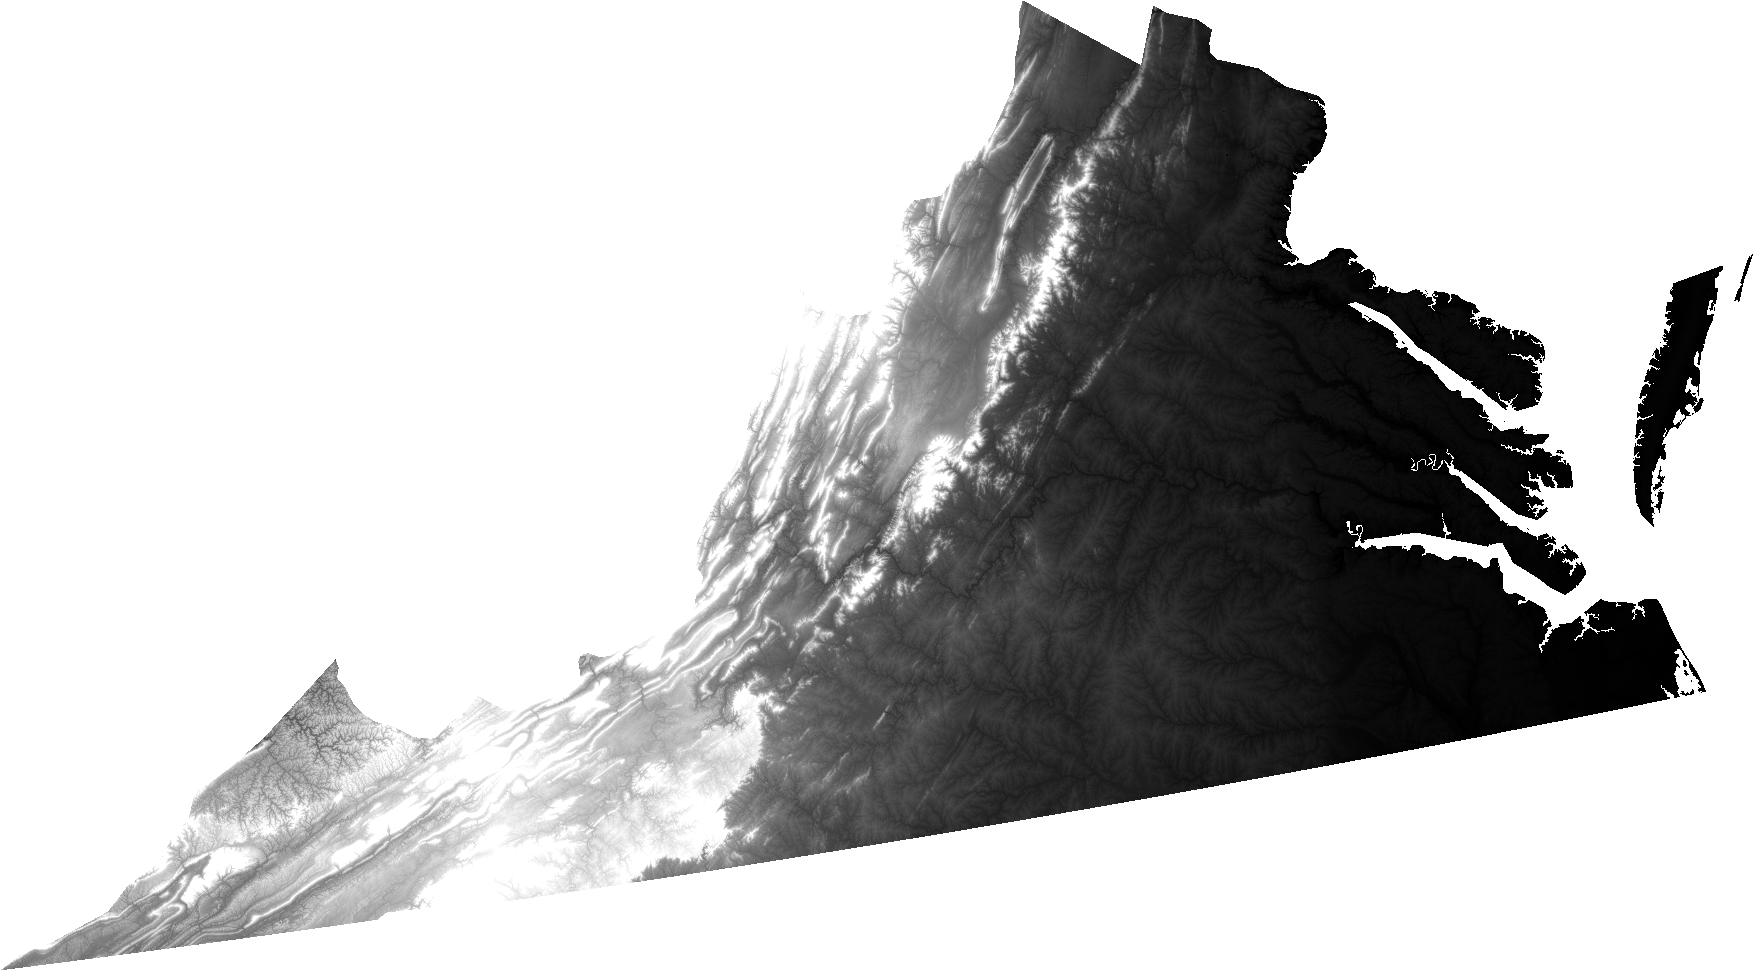
- Lastly, you can re-export the clipped layer at a suitable resolution and format. Right click the
va-elevlayer and selectSave Asand set a file name.Note the
Resolutionsection lists the layer’s pixel resolution in real-world units (initially about 100 x 100 meters) as well as the overall dimensions in pixels (7017 x 3880). Adjust these to suit; I used 400 x 400 resolution.Also note the
Output mode. A TIFF image is output in both cases. WithRaw data, the pixel values encode real-world units (elevation in meters), appropriate for continued GIS or calibrated 3D work. TheRendered imagemode scales the data to 8-bit range, losing some fidelity, but making it easier to work with in most image editors.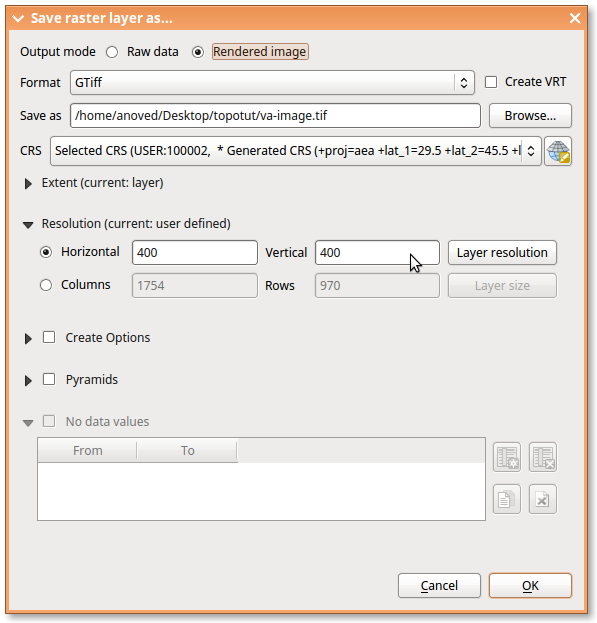


Exercises
Related topics not (yet?) covered in this tutorial:
- Converting the final heightmap to a printable STL
- Reprojecting the elevation dataset to match local/popular reference maps
Posted on Tuesday, September 29th, 2015. Tags: 3d, geography.