Tag Archive: “geography”
Compiling ChoroWare
ChoroWare is a suite of tools used to develop optimal data classifications for choropleth maps. I am surprised that I did not discover it until recently, because this is one of my favorite topics in cartography.
ChoroWare might prove to be particularly useful for ambitious users of free GIS applications like Quantum GIS or ArcExplorer. These programs do not offer very sophisticated classification schemes, but they do allow classes to be defined manually. In this way, I plan to try mapping classifications generated with ChoroWare.
Executable versions of ChoroWare are not available for Mac OS X (or any other platform), so you must build it from the source code. ChoroWare has two main dependencies: GTK+ and GSL. GTK+ itself has numerous prerequisites, which I have described in a separate article (again, it may be wise to use a package manager). Building GSL is relatively straightforward:
gsl-1.11: GNU Scientific Library
./configuremakemake install
With all the prerequisites in place, building ChoroWare is as simple as:
make
I found that make install did not work, so I performed the equivalent action of copying the piping-hot new executables from their various subfolders to /usr/local/bin.
The included example files run without fault. ChoroWare on Mac OS X:
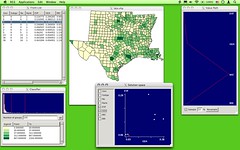
More details about the theory and implementation of ChoroWare can be found in the documentation (PDF) and associated papers (PDF).
Posted on Sunday, September 21st, 2008.
Building GTK+ the Hard Way
Update: Four days after posting this list, GTK+ OS X is available. I’m not sure how to use it build ChoroWare yet, but I’m sure it’s possible (and much easier than the process outlined below).
GTK+ is a user interface toolkit used by many open source software projects.
This is a record of how I managed to build GTK+ on my Mac, not a prescription for the best way to do it. The versions identified here may be out of date, for instance, and there may be additional dependencies I have failed to list. (Most of this work was done months ago, so these steps are based on old notes.)
This procedure yields an X11 version of GTK+. I understand that there is an effort to build a native version of GTK+ for Mac OS X, but this is not it.
I have provided a link to the web site or download area for each library, along with the commands used to build it. You should cd to the library’s directory before running each set of commands. The libraries are listed in the general order in which they were built.
This is probably trivial with a package manager like Fink.
libiconv-1.11: Libiconv (Unicode conversion)
./configuremakemake checkmake install
gettext-0.14.6: Gettext (internationalization)
./congfiguremakemake checkmake install
libtool-1.5.22: Libtool (shared libraries)
Needed by LibJPEG.
./configuremakemake checkmake install
jpeg-6b: LibJPEG
./configure --enable-shared- (Edit line 39 of Makefile to point to path of GNU Libtool.)
makemake testmake install
tiff-3.8.2: LibTiff
./configure --with-apple-opengl-frameworkmakemake checkmake install
libpng-1.2.12: LibPNG
./configuremakemake install
libxml2-2.6.26: LibXML 2
Needed by FontConfig.
./configuremakemake checkmake install
fontconfig-2.4.1: FontConfig
Needed by Cairo.
./configuremakemake checkmake install
cairo-1.2.4: Cairo (graphics renderer)
./configuremakemake testmake install
pango-1.14.4: Pango (text renderer)
./configuremakemake checkmake install
atk-1.12.3: ATK (accessibility)
./configuremakemake checkmake install
glib-2.12.4: The GIMP Library
./configuremakemake checkmake install
Last, but not least:
gtk+-2.10.6: The GIMP Toolkit
./configuremakemake checkmake install
Anyone brave enough to try all this is encouraged to post the inevitable corrections.
Posted on Saturday, September 20th, 2008.
dbfjoin
This program creates a DBF output table by joining records with matching keys from a data table to a main table. Every record from the main table is copied to the output table. If a record with the same key exists in the data table, that data record is appended to the corresponding output record. If the data table does not contain a match, null values are appended instead.
If the format of the main table is “MAINKEY, VAL” and the format of the data table is “DATAKEY, DATA”, the format of the output table will be “MAINKEY, VAL, DATA”.
If multiple data records have the same key, only the first record will be used. If multiple main records have the same key, each will appear in the output followed by the same values from the data table, if any.
Only string, integer, and double (floating-point number) field types are supported.
Example
To use dbfjoin, state the names of the key fields from the main and data tables, followed by the paths to the respective input tables and lastly the path to the output table.
dbfjoin MAINKEY DATAKEY main.dbf data.dbf output.dbf
Acknowledgements
- Shapelib provides an attribute table API to read and write DBF files.
- Christopher Clark’s C Hash Table code helps locate data table records.
- Dan Bernstein’s djb2 hash function powers the hash table.
Download
- Mac OS X universal binary 18.2 KB
- dbfjoin-1.0 source code 11.6 KB
To compile dbfjoin, you will need to edit the makefile to locate your copy of Shapelib.
Posted on Saturday, September 20th, 2008.
Rewriting the Population Analyst
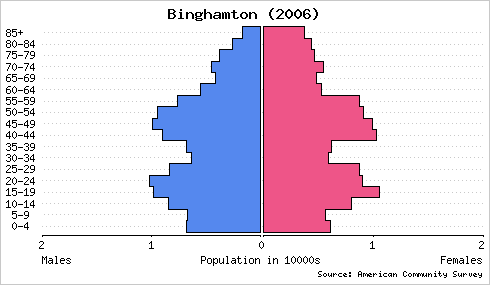
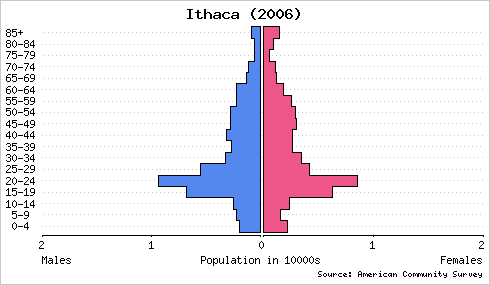
In college I developed a web site called the Population Analyst. It is primarily a tool for demographic visualization with population pyramids. Here are Population Analyst representations of two communities in upstate New York:
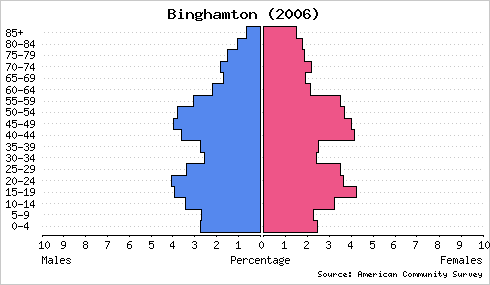
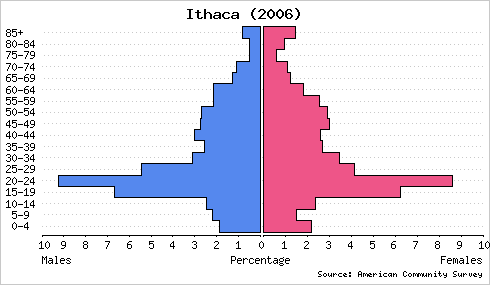
These graphs are drawn with a common scale to facilitate accurate comparison. Clearly, a much greater percentage of Ithaca’s population is comprised of young adults. Plotting population pyramids of Binghamton and Ithaca on an absolute scale reveals that Binghamton has a larger population but similar numbers of young adults.
What do you know about these places that might explain the differences—or similarities—between their population structures? Alternatively, what can you predict about these towns or others with similar compositions?
I would like to rewrite the Population Analyst to make it more useful and easier to use. In addition to streamlining the interface and offering more control of diagram style, I would like to make these basic improvements:
- Provide direct integration with American FactFinder.
- Dramatically simplify input of data from other sources.
- Support arbitrary cohort intervals (instead of 5-year intervals from 0 to 85).
- Support arbitrary population segmentation (not just male and female).
- Offer vector output (PDF, PostScript, or SVG).
Asymmetric data sets (those without matching cohort intervals) should be supported as segments of the same graph as long as a common unit defines their cohort intervals.
The rewrite will not include a population projection component.
My dilemma is whether to implement the new version as a web app or a cross-platform desktop application. The original Population Analyst is a rudimentary web app, of course, but I am better prepared to deliver the desired data handling and interactive visualization features in a desktop environment.
Nevertheless, a program deployed as a web site has the great advantage of immediate accessibility. It would be a useful challenge to learn more contemporary techniques for doing nifty things in the browser. If I can identify good libraries and tool kits to help do some of the things I’ve planned for the new Population Analyst, it may yet remain on the web.
Posted on Thursday, September 18th, 2008.