Rewriting the Population Analyst
In college I developed a web site called the Population Analyst. It is primarily a tool for demographic visualization with population pyramids. Here are Population Analyst representations of two communities in upstate New York:
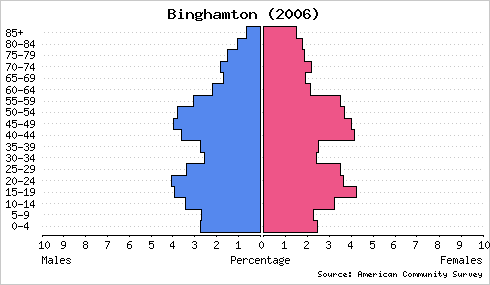
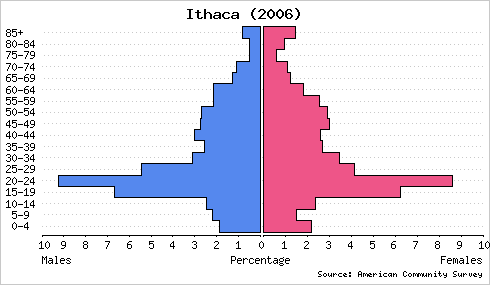
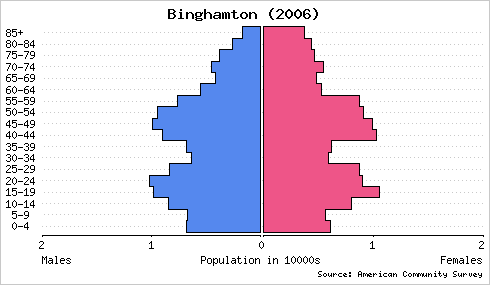
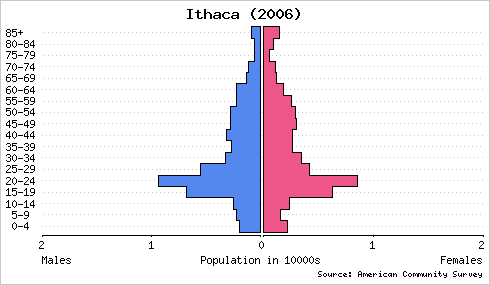
These graphs are drawn with a common scale to facilitate accurate comparison. Clearly, a much greater percentage of Ithaca’s population is comprised of young adults. Plotting population pyramids of Binghamton and Ithaca on an absolute scale reveals that Binghamton has a larger population but similar numbers of young adults.
What do you know about these places that might explain the differences—or similarities—between their population structures? Alternatively, what can you predict about these towns or others with similar compositions?
I would like to rewrite the Population Analyst to make it more useful and easier to use. In addition to streamlining the interface and offering more control of diagram style, I would like to make these basic improvements:
- Provide direct integration with American FactFinder.
- Dramatically simplify input of data from other sources.
- Support arbitrary cohort intervals (instead of 5-year intervals from 0 to 85).
- Support arbitrary population segmentation (not just male and female).
- Offer vector output (PDF, PostScript, or SVG).
Asymmetric data sets (those without matching cohort intervals) should be supported as segments of the same graph as long as a common unit defines their cohort intervals.
The rewrite will not include a population projection component.
My dilemma is whether to implement the new version as a web app or a cross-platform desktop application. The original Population Analyst is a rudimentary web app, of course, but I am better prepared to deliver the desired data handling and interactive visualization features in a desktop environment.
Nevertheless, a program deployed as a web site has the great advantage of immediate accessibility. It would be a useful challenge to learn more contemporary techniques for doing nifty things in the browser. If I can identify good libraries and tool kits to help do some of the things I’ve planned for the new Population Analyst, it may yet remain on the web.
Posted on Thursday, September 18th, 2008. Tags: geography.
One Response to “Rewriting the Population Analyst”
Posted by Jim on Friday, September 19th, 2008 at 6:55 PM.
I have received a comment that integration with statistical packages like Stata or R might be useful for users of those tools. With a modular input/output interface it should be possible to provide such integration.
Note that the increased flexibility of data format is geared towards extending the utility of the graphing program to a broader audience. Support for arbitrary data sets means that the Population Analyst will be able to help visualize work in a variety of fields.